.jpg)
For most cities, the skyline is fairly dependable and only gradually changes as new buildings are erected or as old ones demolished.
It's not like that in Southampton.
Southampton's skyline is fluid, frequently changing overnight as massive cruise ships dock in the early hours and add themselves as a backdrop to the city for a few days before departing for Norway or the Mediterranean or New York.
This was a little project to bring a sense of that constant movement indoors.
I wanted to make a ship-counting device which would give an indication of the current busy-ness of Southampton's port. I wanted to make something I'd be happy to hang on an interior wall. I dislike LCD screens, they are energy-intensive and intrusive.
I do like the tangibility of Lucy Kimbell's physical bar charts: vertically mounted transparent tubes full of coloured badges, several in parallel, in which the levels vary as people take the badges. Also, Waitrose's Community Matters voting bins!
I played around with the idea of an Archimedes' screw which would dispense a tiny model ship for each actual ship currently berthed, but for simplicity, I opted for stepper motors which would unwind a spool of canvas a few inches for each vessel.
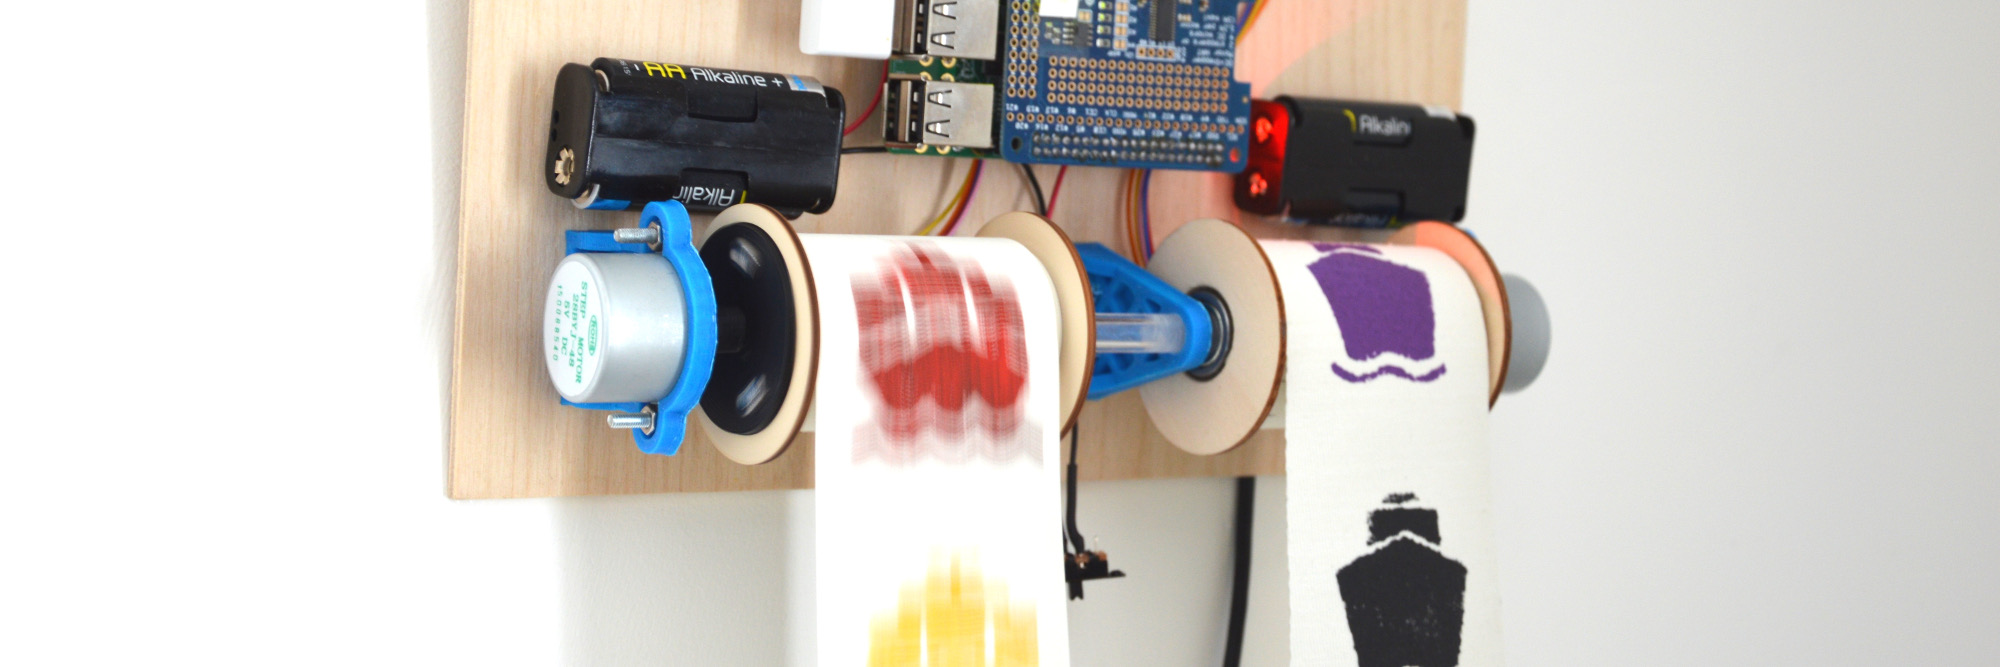
Here's the current prototype, showing at least four cargo ships and two passenger ships currently docked in Southampton:
.jpg)
I made two spools, one for cargo ships and one for cruise ships and other passenger boats. Each is long enough to display about twenty ships when fully extended. They are mounted like tiny rolls of toiler paper, hanging down from a sheet of plywood.
Each spool rotates on bearings on an acrylic shaft, attached to the plywood base via a couple of brackets which I 3D printed at Southampton's makerspace. Each has a stepper motor controlling its current position, also mounted to the plywood.
I painted an icon of a ship every few inches along each spool's canvas. Because the radius of each spool decreases as it is unwound, the stepper has to compensate, unwinding more material when the spool is almost empty (i.e. displaying many ships).
The data was easily available from Associated British Ports, which is the Port Authority in Southampton. Their website publishes live shipping information, including a page called 'vessels alongside', which is in turn generated from an XML file.
The live data is quite informative. It includes the ship's name, Lloyds number, type, nationality (or flag), arrival time, berth, origin and various dimensions (draft, length overall, deadweight tonnage). My device only uses the type field.
To get a sense of the data (and how many ships arrive and depart over a typical day), I collected it for a few days first. A stacked chart shows that there are many different types of ship and boat that dock in Southampton:
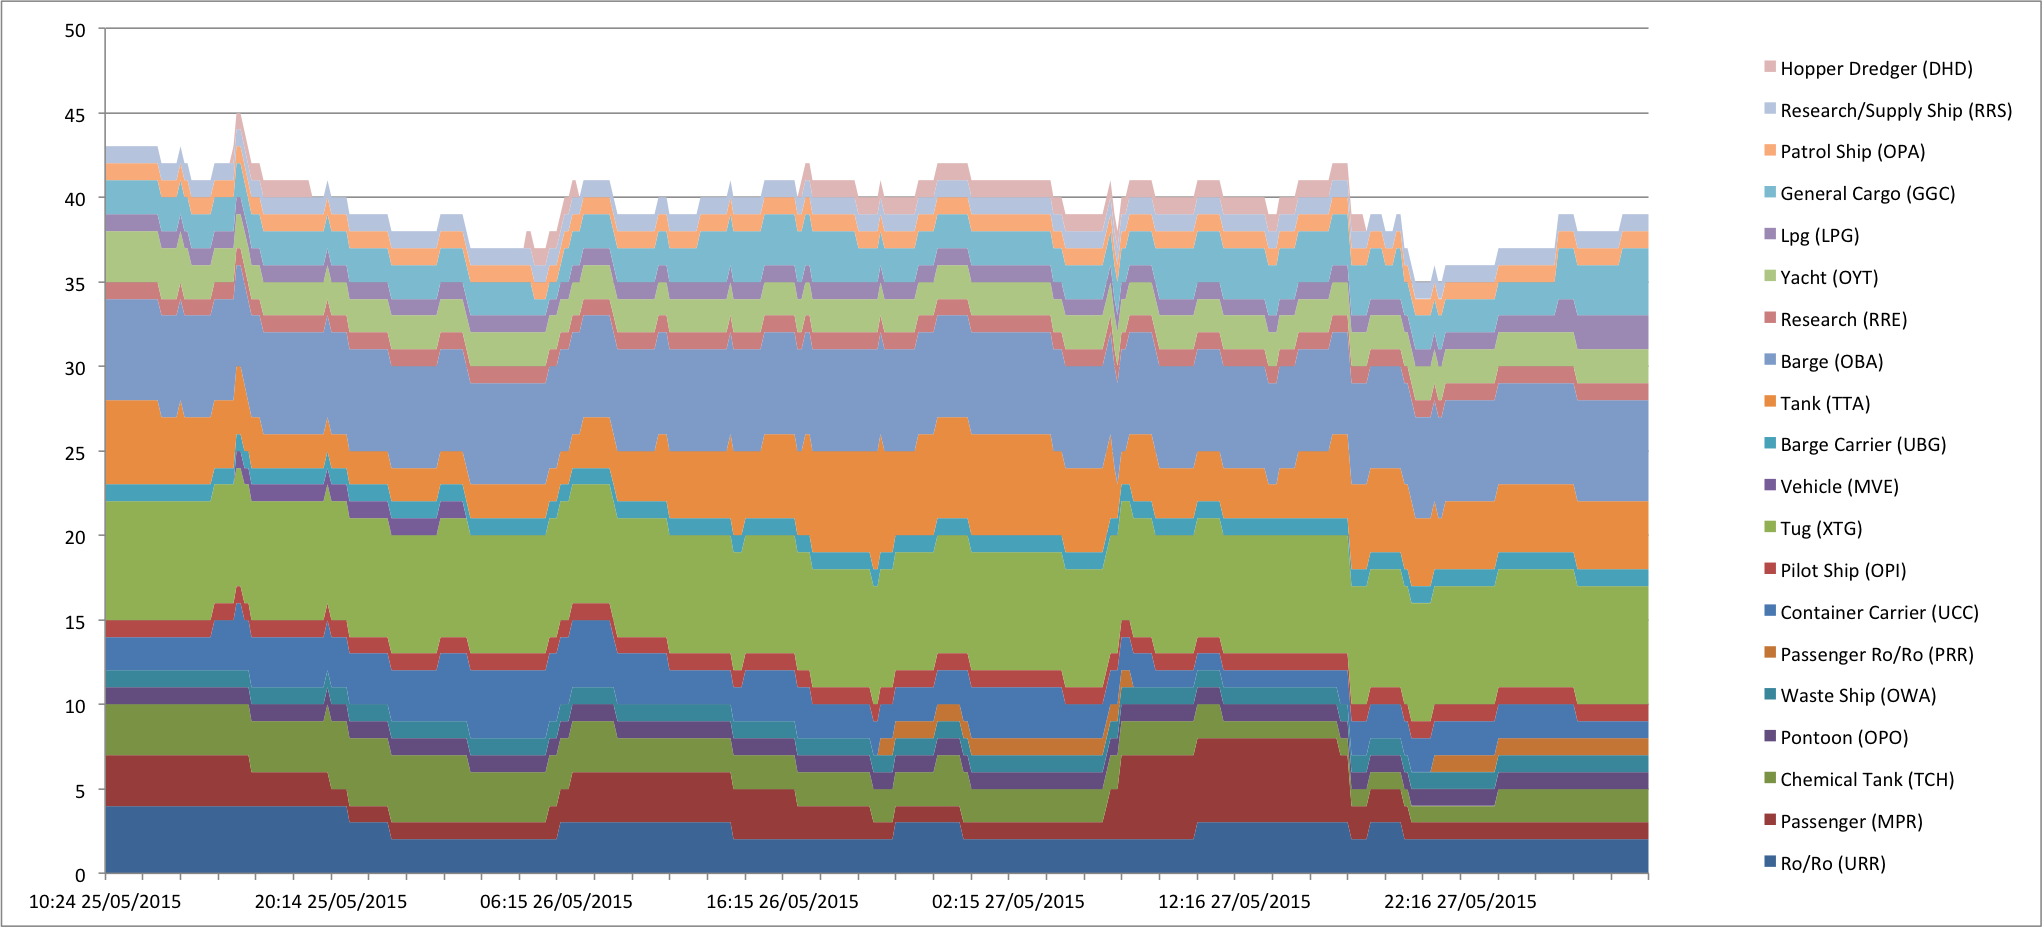
Some of those types:
Many types were only present in small quantities or didn't change frequently enough to be of interest to me. I wanted ships that were sufficiently large (i.e. in tonnage) to be of general interest, were present in sufficient numbers, and that changed frequently.
The following chart shows the same data as above in two groups. 'Cargo' includes Ro/Ro (URR), Container Carrier (UCC), Vehicle (MVE) and General Cargo (GGC). 'Passenger' includes Passenger (MPR), Passenger Ro/Ro (PRR) and Yacht (OYT).
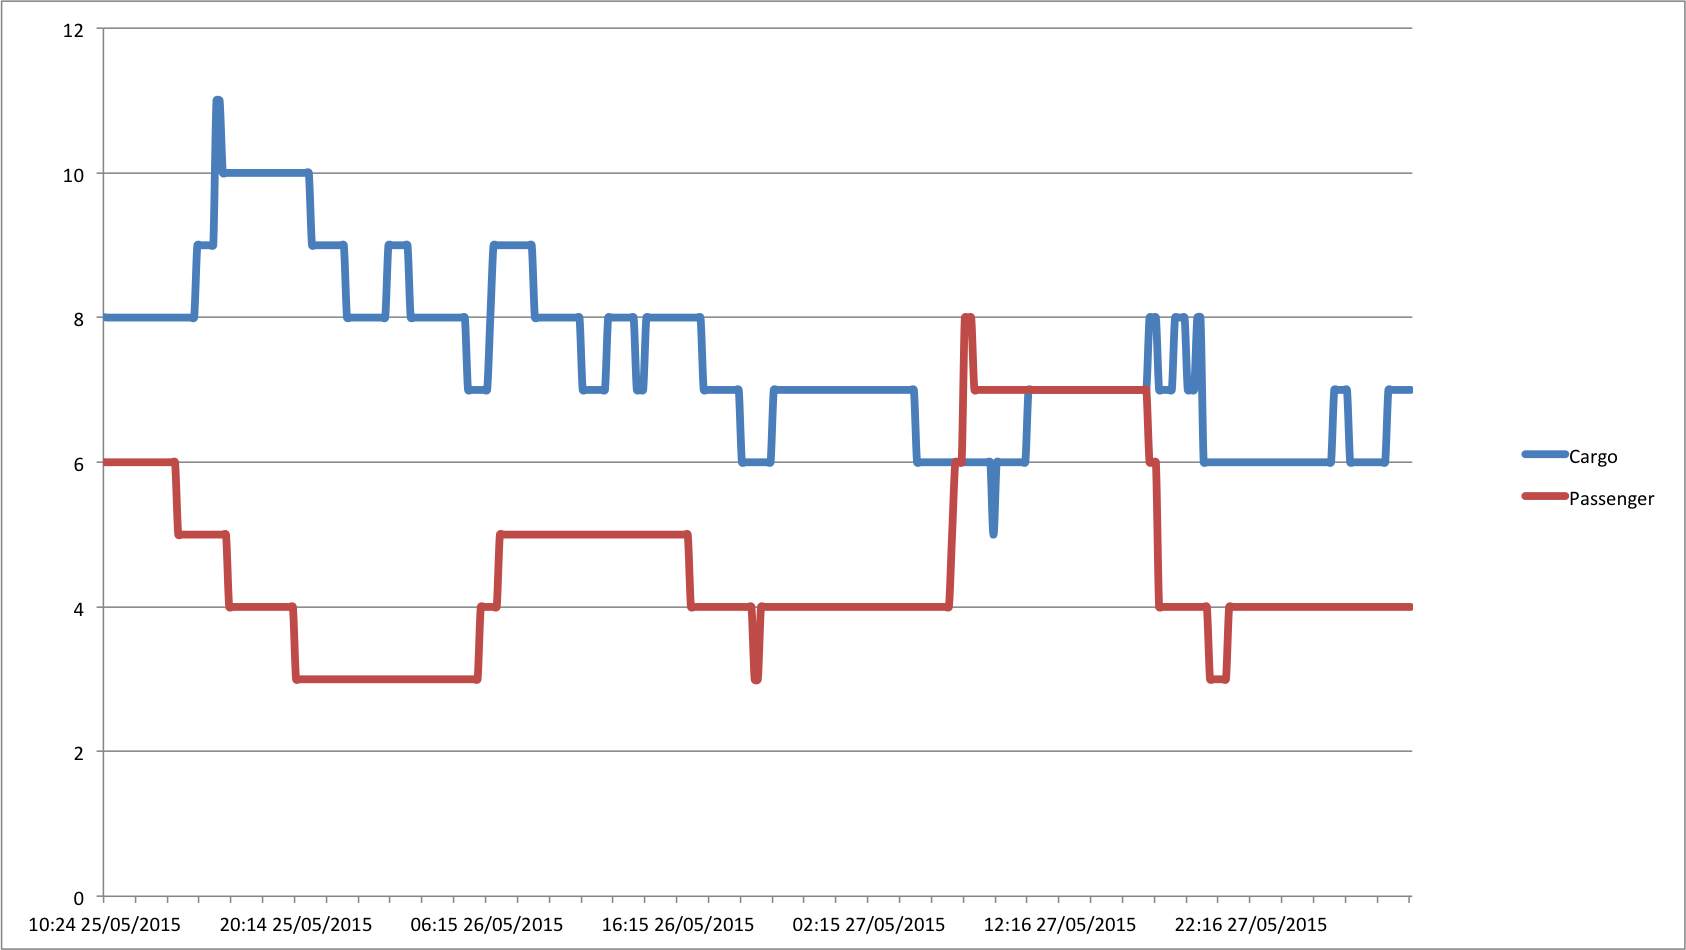
In general, although there are usually more cargo than passenger ships, these groups looked sufficiently sizeable, balanced and varied to make a good display.
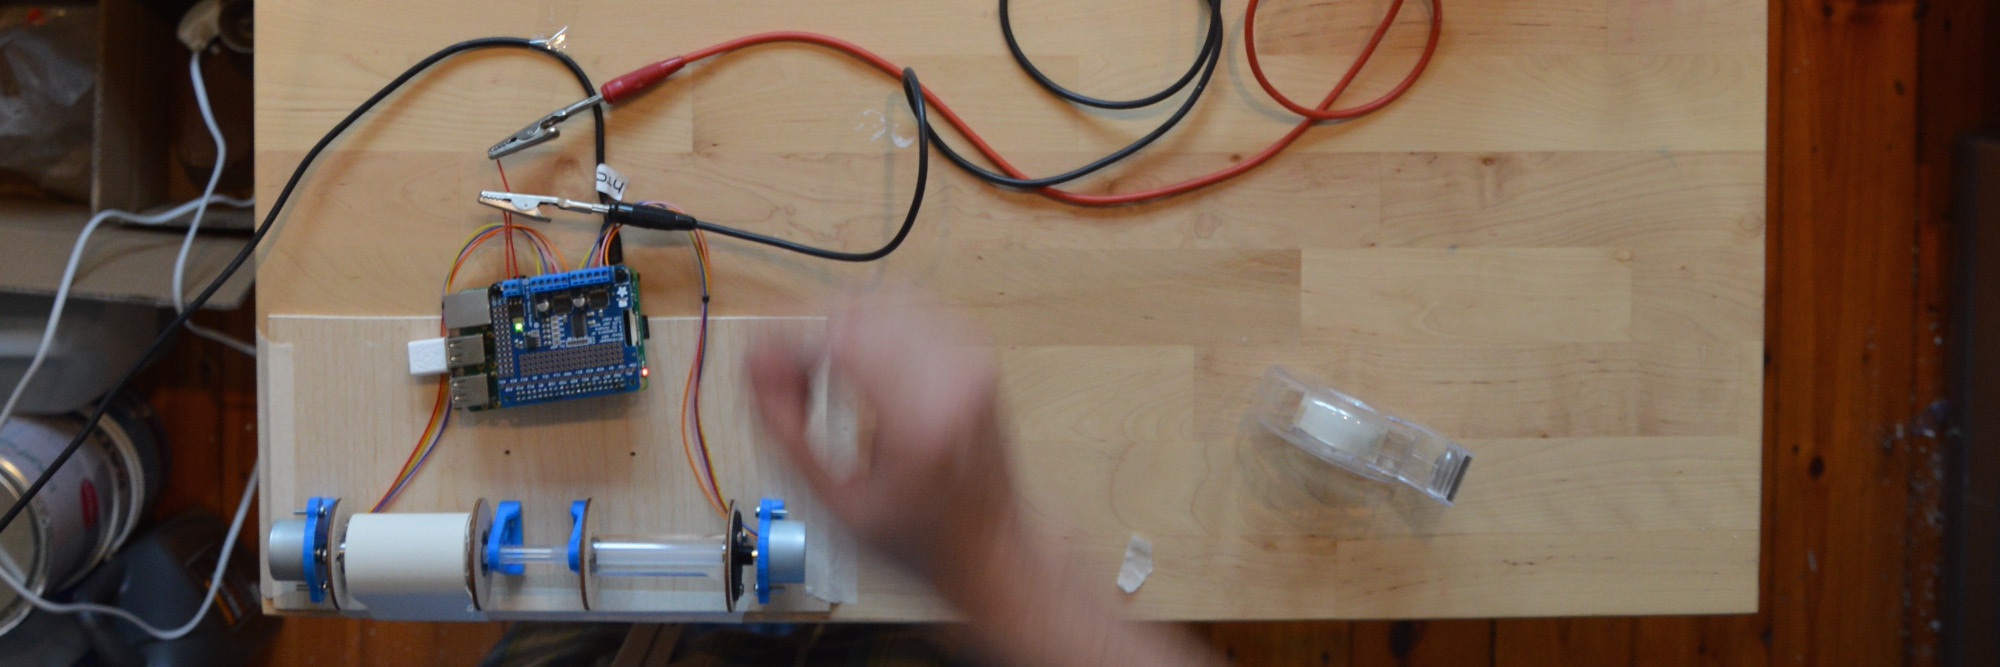
I used a Raspberry Pi to collect the data from the Port Authority, parse it and control the stepper motors. The Pi is connected to my home WiFi through a dongle and runs a Python script as a Cron job every five minutes. The script:
As I mentioned above, although the icons of the ships are printed at equal intervals along the canvas, the script has to vary how much material to pay out, as the radius changes when there are more ships displayed.
Here's the code that calculates required steps based on the current totals:
def calculateSteps(currentShips):
    spoolMin = 25/2 # Minimum radius of the spool
    spoolMax = 35/2 # Maximum radius of the spool
    shipsMin = 0 # Minimum number of ships displayed
    shipsMax = 20 # Maximum number of ships displayed
    radius = spoolMax-((currentShips-shipsMin)*(spoolMax-spoolMin)/(shipsMax-shipsMin)) # Linearly scale the current number of ships into a spool radius
    circumference = 2*math.pi*radius # Calculate the circumference
    height = 65 # The distance between each ship
    revolutions = height/circumference # Revolutions required to extend / retract the right amount of material
    steps = int(revolutions*513) # The steps required by the above revolution
    return steps
Instead of re-inventing the wheel, I used an off-the-shelf Raspberry Pi HAT (Hardware Attached on Top) from Adafruit which connects to the Pi and contains the required H-bridges to drive the steppers (it also comes with a library).
The motors themselves are quite cheap ones. I'm single-stepping them because they come fitted with little gearboxes which take them down to 513 steps/rev; definitely accurate and torque-y enough for this project.
Here's a gif showing the device display some dummy data:
New #RaspberryPi project: physical bar charts show total cargo & passenger ships currently berthed in Southampton… pic.twitter.com/yi4Sl4zCfJ
— Jamie Young (@dt99jay) 31 October 2015
You can have a look at the rest of the code here if you're interested.