Every year or so my wife and I go through our joint bank account and look at what we spent money on that year. It's laborious to categorise each transaction and I wondered whether the process could be automated.
Turns out it can! I used a classifier algorithm to automatically categorise transactions into groups like 'travel', 'groceries', 'eating out' and so on.
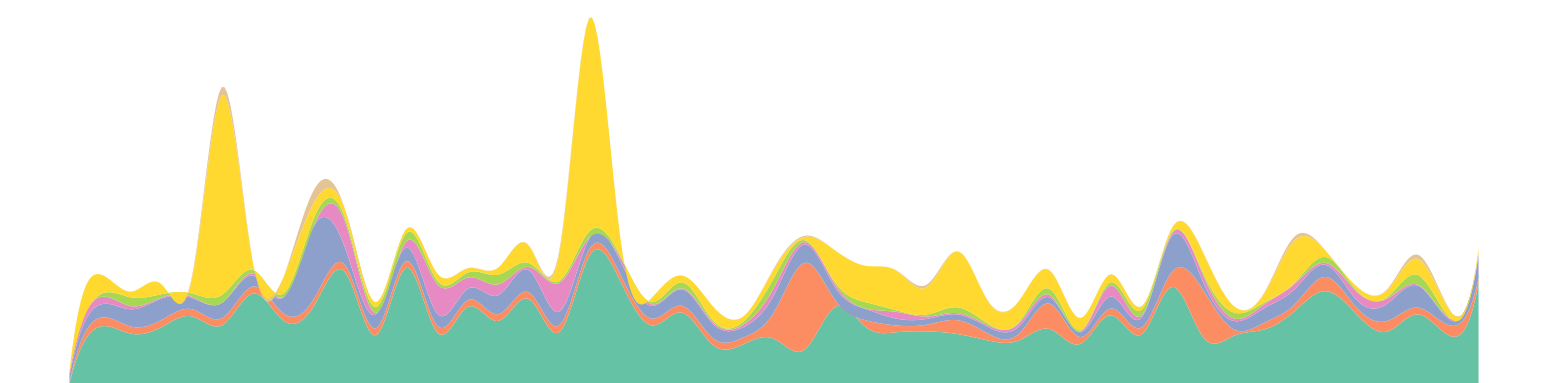
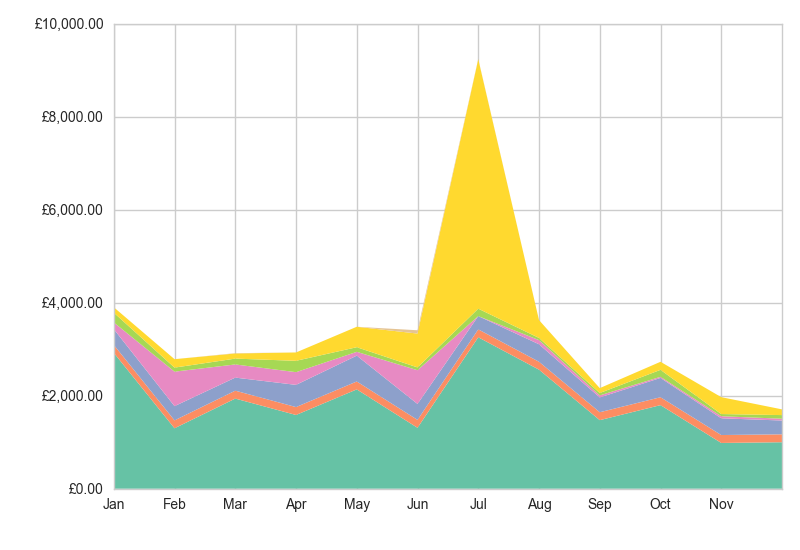
Here's the kind of chart I've been able to automatically generate. This is categorised spending from 2012 (the yellow segment is the 'transport' category, which peaked on the wallet-busting day when I bought my rail season ticket):
Here's how the system works:
Our bank lets us download a .csv file of transactions for each month, with a row for each item of income or expenditure, like this:
Date,Description,Amount,Balance
21/03/2011,COSTA CJ ST JOHNS         LONDON SW11 1,-6.55,XXX*
15/03/2011,SCOTTISHPOWER PLC,-37,XXX*
10/03/2011,BOOTS 0330                OXFORD,-5.11,XXX*
* Balances replaced with 'XXX'
Each of these rows contains various bits of information (or 'features') which could be used by a classifier to sort a transaction into the correct category, for example:
There are various classifier algorithms implemented in different libraries. I used the scikit-learn library for Python, which makes experimenting with different classifying algorithms quite straightforward.
Classifiers are a 'supervised learning' technique, which means they need to be trained on some data first. To do this, I manually categorised bank transactions from 2011 and used those as the training set.
I started by using the 'Description' field to train my classifier. Each description is formed into a 'term-frequency times inverse document-frequency' (tf-idf) matrix, which is a way of giving more weight to the important words in a string.
To test the accuracy of the classifier, I also categorised transactions from 2012 to form a test set. My data is tiny: I had a training set of 538 and a test set of 843 transactions, classed into about 35 categories.
(The training set should probably be larger than the test set.)
I used a Naive Bayes classifier first, which gave me about 56% accuracy of allocating the transactions into the correct category - a bit disappointing! (NLTK's implementation gave me a similar result.)
One of the nice things about scikit-learn is that it makes it easy to try other algorithms. I tried several of the classifiers demonstrated here, which returned accuracies from lower than 50 up to 70%.
The best results (up to about 76%) were with the SGDClassifier, which is a 'linear support vector machine (SVM)' with 'stochastic gradient descent (SGD)' learning - SVMs are supposed to be more effective on smaller datasets like mine.
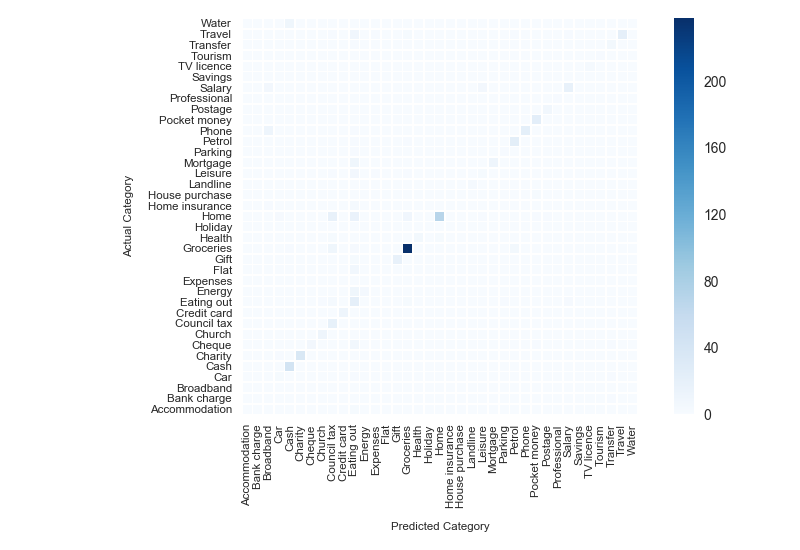
Just for interest, the 'confusion matrix' shows which categories the classifier struggled to distinguish. The Bayes clasifier often mis-classified 'petrol' transactions as 'groceries', but the SVM seems better able to tell the difference:
The accuracy would be improved with a larger training set and probably with fewer categories, but 76% accuracy is acceptable for my purposes. I don't mind a bit of uncertainty in the results as long as it's predictable...
...Which it is. Classifiers can often return the probability that their prediction is correct. This histogram shows that correctly and incorrectly classified transactions can be predicted by the classifier's probability score:
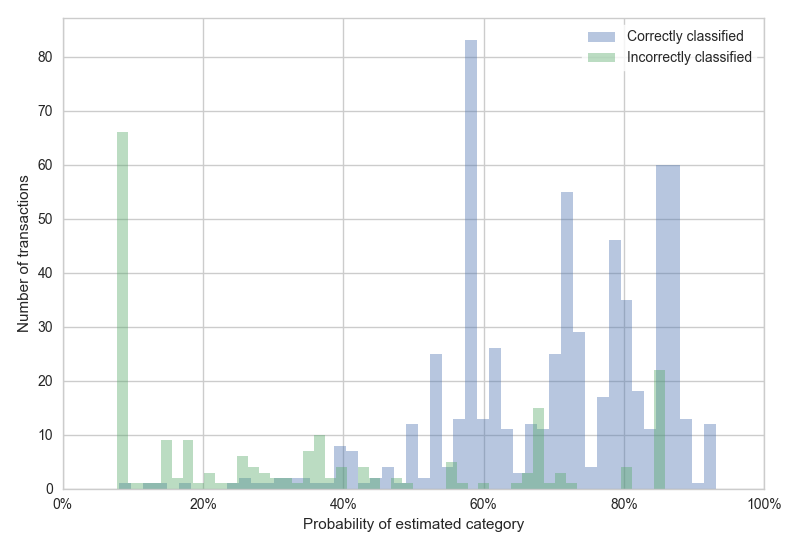
It's acceptable for some transactions to be misclassified, but I want to know if large transactions are likely to be mis-classified. If a transaction has a probability <25% and a value >£100, this can be flagged for manual classification.
The probability score also demonstrates the limitation of using an old year as my training set. My income and spending patterns have changed over the years, so if I run more recent data through the classifier there are more uncertain classifications.
I also experimented with adding other features into the classifier, such as the transaction amount. Scikit-learn makes this possible through its Pipeline and FeatureUnion classes, like this:
pipeline = Pipeline([
    ("union", FeatureUnion(
        transformer_list = [
            ("description", Pipeline([
                ("selector", ItemSelector(column="Description")),
                ("tfidf", TfidfVectorizer())
            ])),
            ("amount", Pipeline([
                ("selector", ItemSelector(column="Amount")),
                ("scaler", StandardScaler())
            ]))
        ],
        transformer_weights = {
            "description": .9,
            "amount": .1,
        },
    )),
    ("classifier", SGDClassifier(loss="log"))
])
However this was not very effective: accuracy went down as a result of the second feature, so I've retained it but only at a low weighting.
I think there's some potential here for an automated system. I'm not posting all my data for obvious reasons, but if you are interested, you can see some of the classification and charting code (it's scrappy!) I used in this repository.